Ishikawa Diagram: A Guide
Learn how to use an Ishikawa diagram to improve quality control. Find out what the 6Ms are in the Ishikawa diagram and more.

Learn how to use an Ishikawa diagram to improve quality control. Find out what the 6Ms are in the Ishikawa diagram and more.
Published 28 Apr 2026
Article by
6 min read
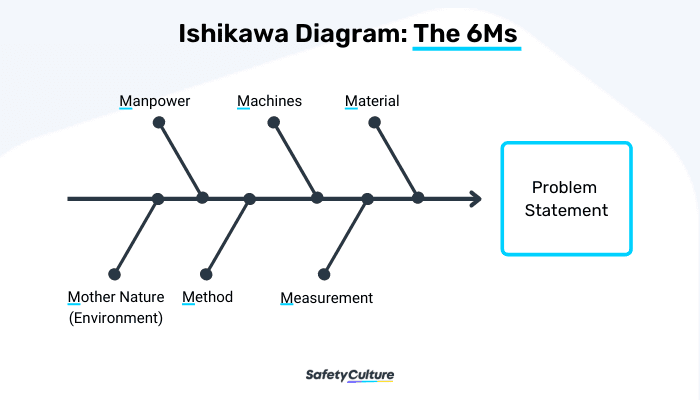
Ishikawa diagram, also called the Fishbone diagram, is a visual tool used to identify problems in a system. It shows how causes and effects are linked and helps analyze what is going wrong with systems, processes, and products. The name comes from Japanese engineer Kaoru Ishikawa, who developed the method in the 1960s.
The 6Ms in the Ishikawa Diagram:
Material
Method
Machine
Measurement
Manpower
Mother Nature
Using this diagram, engineers may better understand manufacturing process defects. But today, many marketers also use the Ishikawa diagram to analyze complex situations and find the most effective solution for their businesses.
Ishikawa diagrams can be helpful in any situation where there is a need to analyze complex problems or identify the causes of issues in a system. Teams often use them in manufacturing, marketing, product development, and other fields that involve working with people, processes, and procedures. Some common situations where Ishikawa diagrams may be helpful include:
When identifying the root causes of a problem
When brainstorming solutions to a problem
When developing or improving a process
When analyzing data from customer surveys
When evaluating the results of a marketing campaign
When troubleshooting an issue with a product or service
When planning future projects or initiatives
There are several advantages of Ishikawa diagrams, including:
They help identify the root causes of problems.
They help team members communicate and share ideas more effectively.
They enable teams to visually organize complex information.
They can be used to brainstorm solutions to problems.
They allow teams to track progress and plan future actions.
There are a few disadvantages of Ishikawa diagrams to consider, including:
They can be time-consuming to create.
They can be challenging to interpret if not well-designed.
They may be biased or incomplete if team members do not actively participate in the analysis process.
There can be a risk of focusing too heavily on individual factors instead of considering how they might interact with each other.
They can be challenging to apply in situations where multiple interrelated factors are involved.
The 6Ms in the Ishikawa diagram are critical factors used to identify and analyze problems in a system. These factors include:
Material – This refers to any physical or non-physical components of the system, including people, resources, and tools.
Method/Process – This refers to the methods and procedures used to produce or deliver the product or service.
Machine – This refers to the assets such as machines and equipment used to create or provide the product or service.
Measurement – This refers to the tools and methods used to measure progress and performance.
Manpower – This refers to the people involved in producing or delivering the product or service.
Mother Nature (Environment) – This refers to the external factors that affect the system including weather, geography, and regulation.
When generating an Ishikawa diagram, there are a few steps to follow:
Start by clearly defining the problem you are trying to address using your fishbone diagram. It could be a quality issue, employee dissatisfaction, or any other issue that you want to understand and improve. You can use paper checklists or spreadsheets to define the problems or use specific tools such as SafetyCulture (formerly iAuditor) to capture and organize your specified issues.
Problem Definition Tips:
Be as specific as possible when defining your problem. It will make it easier to identify root causes later on.
Make sure that everyone on your team understands the problem in the same way. Use a problem statement to ensure that everyone is on the same page.
Sorting potential causes into different categories makes it easier to identify root causes later on. You can use the 6Ms as a starting point to help you decide on key types.
Once you have decided on your key categories, you can begin brainstorming possible causes for each one. Consider all of the factors that could affect your process or product and note them down as potential causes. Below is an example of possible causes in each category using the 6Ms (Material, Method, Machine, Measurement, Manpower, and Mother Nature).
Once you have a list of possible causes, it is helpful to sort and prioritize them based on their likelihood of being root causes. It will help you focus your efforts on the most likely reasons. There are a few different quality management tools you can use to sort and prioritize potential causes; some of these include:
The 5 Whys: This technique can be used to drill down to the root cause by asking “why” five times.
Pareto Analysis: This technique can help you prioritize potential causes by identifying the most common ones.
Failure Modes and Effects Analysis (FMEA): This risk analysis tool can help you prioritize possible causes based on their potential impact.
After you have sorted and prioritized your potential causes, it is time to start testing them to see if they are root causes. Trying to find out what might be the possible causes can be done in several ways:
Option A: Process Map Branching out from the main problem, you can create a process map to test different potential causes. Using a process map, you can identify the gaps in your system that may lead to your problem’s root cause.
Option B: Brainstorming You can also use brainstorming techniques to identify potential solutions that could address the root cause of your problem. It is an excellent way to get input from various team members and stakeholders.
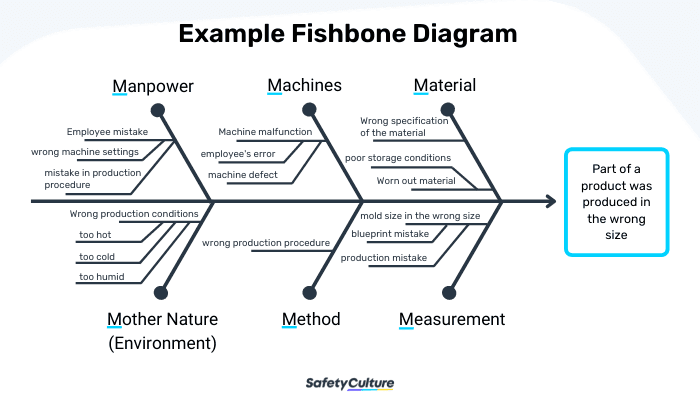
Below is an example of a fishbone diagram for a manufacturing company. In this scenario, the company uses the 6Ms to better understand the causes of the problem, which is that a part of the product is in the wrong size.
The problem is stated on the right, with possible causes of the problem listed in the ribs under each 6Ms category.
One of the main challenges remote teams face when conducting root cause analysis is coordinating and communicating effectively. It can be difficult, primarily if team members are spread across different time zones.
Another challenge is ensuring that tasks or follow-ups are assigned to the correct person or team. In a remote setup, it’s easy to forget who’s responsible for what and to track tasks that aren’t assigned right away. However, there are tools like SafetyCulture (formerly iAuditor) that can help with this issue.
As an Ishikawa tool and hazop software, SafetyCulture makes it easy to create and share checklists, assign tasks, and track the status of audits or investigations. It also allows remote teams to collaborate more efficiently through real-time notifications and updates. Moreover, it has built-in templates for conducting root cause analysis, which can help train and guide your team through the process.
In this article