Quality Management Tools: Building Customer Trust Through Reliable Performance
Discover how quality management tools help teams drive consistency, maintain compliance, and improve workflows across every process.

Discover how quality management tools help teams drive consistency, maintain compliance, and improve workflows across every process.
Published 28 Apr 2026
Article by
7 min read
Quality management tools help teams deliver consistent, high-quality products and services. They give teams the means to manage tasks, run audits, stay compliant, and use data to improve how work gets done and the quality of any product manufactured or service provided.
The use of these tools began with Kaoru Ishikawa, a Japanese engineer and professor at Tokyo University. He introduced them to solve common challenges in manufacturing and business such as poor teamwork, misalignment, and weak accountability for quality. His goal was simple: give employees access to the same tools and data so they could take ownership of quality every day.
Quality management matters because it gives businesses a clear, flexible framework to improve how work gets done. It helps raise the standard of products and services so they meet customer needs and expectations.
Good quality management keeps production consistent, cuts waste, and helps teams focus on doing their best work. When performance, availability, or reliability fall short, customers notice. That can lead to complaints, churn, and profit loss.
Quality management tools help teams track and improve every stage of the process. With the right tools in place, teams can spend less time chasing problems and more time improving products and delivering real results.
Cultivate a culture of excellence with our digital solutions that enhance efficiency, agility, and continuous improvement across all operations.
There are seven main quality management tools used to identify possible causes of a problem by analyzing observations and collected data such as frequency, location, and defect type. These help teams find root causes and prevent the same issues from happening again.
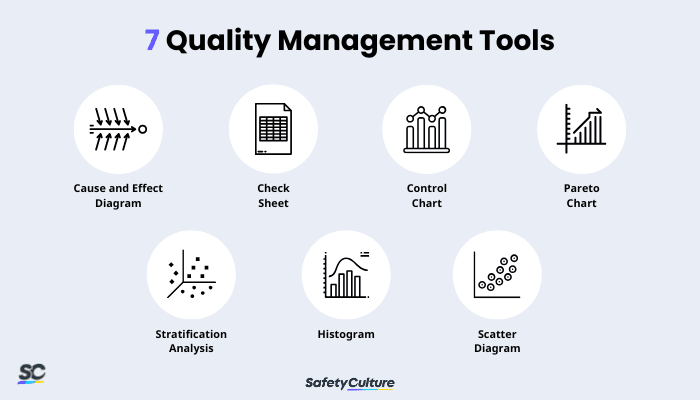
7 Quality Management Tools
The cause and effect diagram, also known as the fishbone diagram, helps identify possible causes of an issue using a template with a resemblance to a fishbone. Quality management teams can identify a quality-related problem on the right-hand side of the diagram, with individual root causes and sub-causes branching off to its left. Mostly, categories such as methods, equipment, people, environment, and materials are used to identify the possible cause of the problem.
A check sheet is a structured presentation of gathered data that are collected repeatedly by the same person from the production process. It helps identify defects based on type, location, or cause, allowing quality management teams to eliminate defects or errors within processes, products, or services. This quality management tool also helps businesses record preliminary data distribution and its frequency when measuring out processes, indicating the number of times a particular value has occurred. .
A control chart is also known as the Shewhart chart and is used to study the changes in the process over time. It shows whether the process variation is in control or is affected by different causes of variation, which is based on a comparison of historical control limits and current data. A control chart makes it easy for quality managers to identify factors that may lead to variations or defects, as it helps them analyze and consider whether a process is stable or predictable.
A Pareto chart is used to identify the most significant issue in the production processes that needs immediate rectification. It uses a combination of line and bar graphs to present the frequency of issues in the production process. With this quality management tool, businesses can highlight the relative importance of a variety of parameters to analyze and determine the most impactful factor on a specific process or system. Quality managers can also use this chart to sort the number of defects from the largest to the smallest occurrences in order to identify which to prioritize in terms of improvement efforts.
A stratification analysis helps quality managers divide different factors such as objects, data, and people into distinct groups to determine the revealing patterns that are not visible when those factors are lumped together. This quality management tool is used mostly when data comes from different sources and analysis may require sorting out from these sources. It can be presented in combination with other data analysis tools to identify the circumstances that could affect the quality of delivery.
A histogram is utilized to show frequency distribution using numerical data. It is somehow similar to a bar graph, as it shows patterns that fall within common process conditions. It helps quality management teams analyze the output from the processes of suppliers and check whether a process has changed from one period to another. This quality managemeng tool can be presented in different shapes as follows:
Normal distribution
Bimodal or double-peaked
Skewed distribution
Multimodal distribution or plateau
Edge peak distribution
Heat-cut distribution or truncated
Comb distribution
Dog food distribution
Unlock hidden efficiency
Middle managers lose over 5 hours each week on low-value tasks—time that could be spent driving meaningful progress. Learn why they hold the key to operational success.

A scatter diagram is the most useful quality management tool in describing the cause and effect relationship between two variables. It uses the X and Y axis to look for relationships between quality defects and possible causes including activity, personnel, environment, and other variables. It also helps determine whether two effects that appear to be related occur with the same source.
Quality managers are responsible for maintaining the high value of products or services and ensuring they consistently achieve customer satisfaction. It is vital to spot quality or product-related issues and defects early on before they reach end-production to avoid business damage. To efficiently perform their duties, they use quality management tools to identify issues and apply immediate corrective actions. Some of their tasks include the following:
Data gathering is a crucial part to identify the cause and effect of an issue or defect. It is the starting point in creating hypotheses to identify the root cause of a problem. Collected data should be accurate and reliable to formulate appropriate insights and analysis.
After gathering data on the product or service provided, it’s time to identify the problem to solve. The different quality management tools used to identify the problem depend on the needs of the company. It is vital to identify the cause of the problem in order to ensure the quality of products or services.
Traditionally, quality checks were done with pen and paper. But with digital solutions like SafetyCulture, that approach is now outdated. Using this technology, quality managers can now achieve the following:
Get real-time data – Access quality checks anytime and anywhere, even offline. When changes are made or processes need updating, everything syncs in real time so teams always have the latest information.
Turn issues into actions – Assign corrective actions to the right team members with clear task details, priority levels, and due dates. Ask for feedback to keep improvements on track.
Provide photo evidence – Capture photos of defects and other issues in-app. Most digital solutions also have the option to annotate and attach notes so teams can discuss and resolve problems faster.
Send a quality assessment report immediately – Once the inspection is complete, send the finished audit to anyone in your organization. You can also share it from the mobile app and email it directly to specific team members.
Create customizable templates – Choose from ready-made templates or build your own with SafetyCulture to suit your industry and specific processes. This helps teams standardize checks and capture consistent data every time.
SafetyCulture is a mobile-first operations platform adopted across industries such as manufacturing, mining, construction, retail, and hospitality. It’s designed to equip leaders and working teams with the knowledge and tools to do their best work—to the safest and highest standard.
Streamline processes, eliminate bottlenecks, enhance resource utilization, and build an agile and scalable infrastructure with SafetyCulture. Strive for operational excellence to boost competitive advantage, foster sustainable growth, and deliver long-term value.
Save time and reduce costs
Stay on top of risks and incidents
Boost productivity and efficiency
Enhance communication and collaboration
Discover improvement opportunities
Make data-driven business decisions