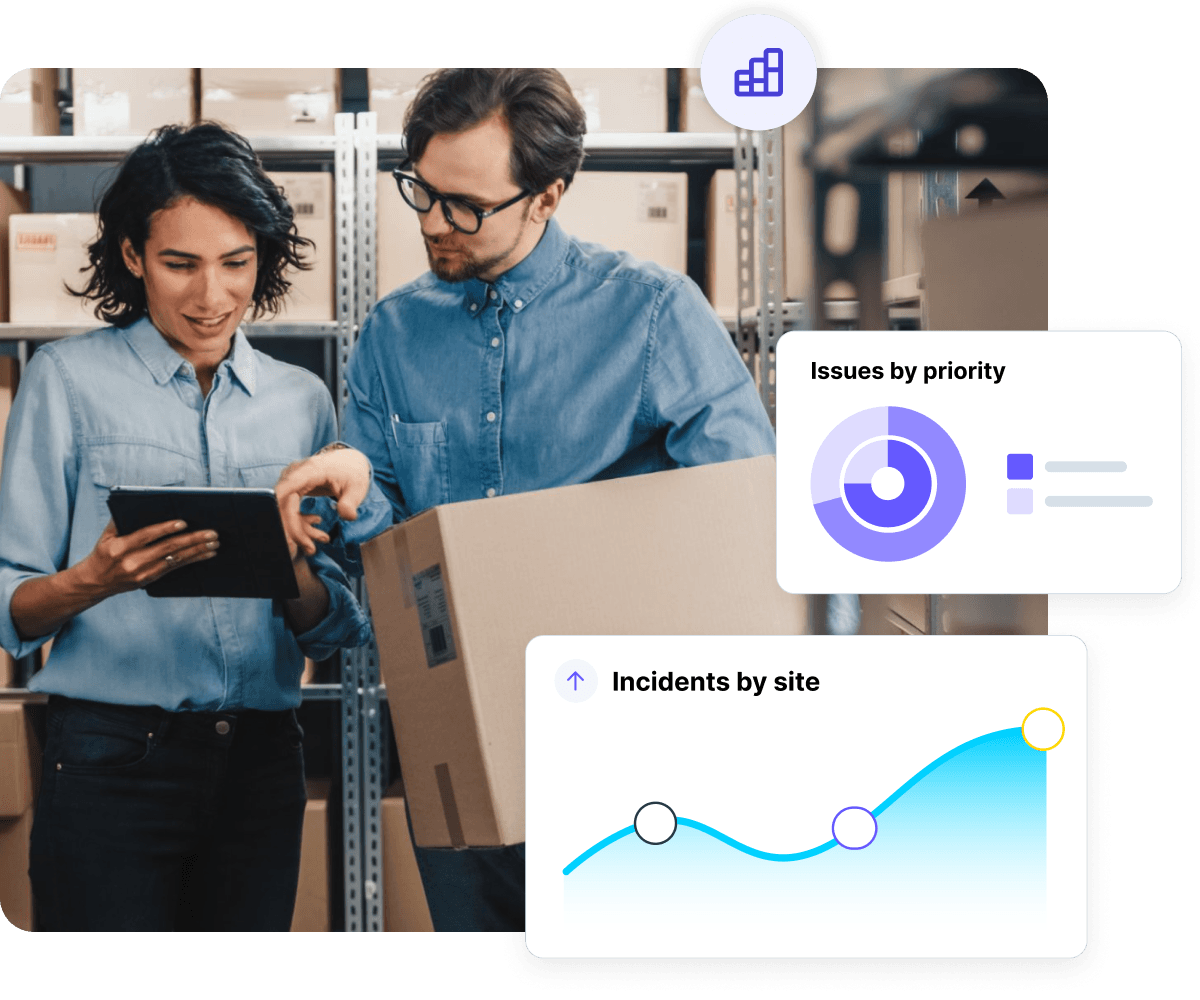
Build dashboards in clicks
Build dashboards in clicks
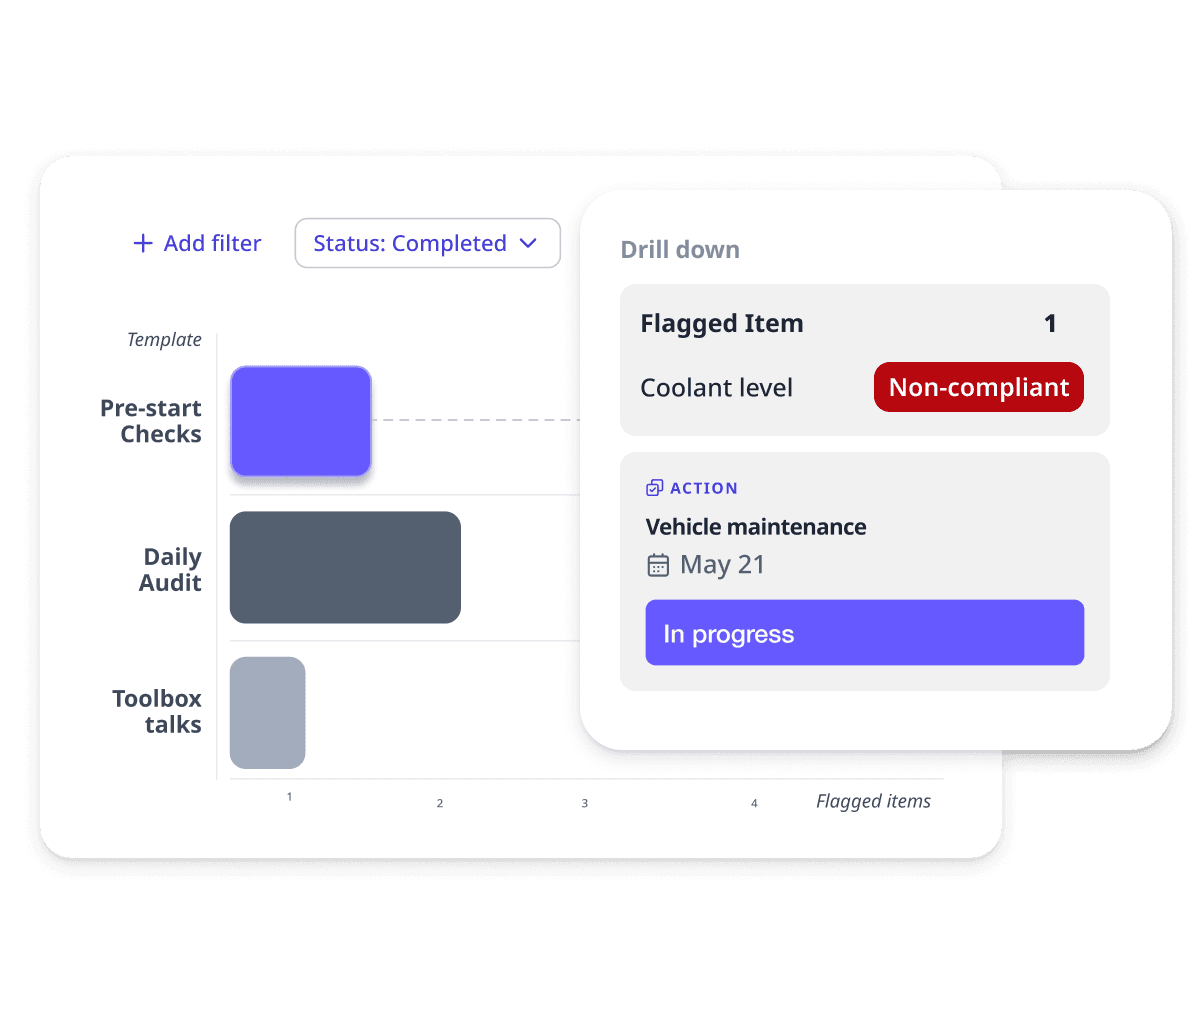
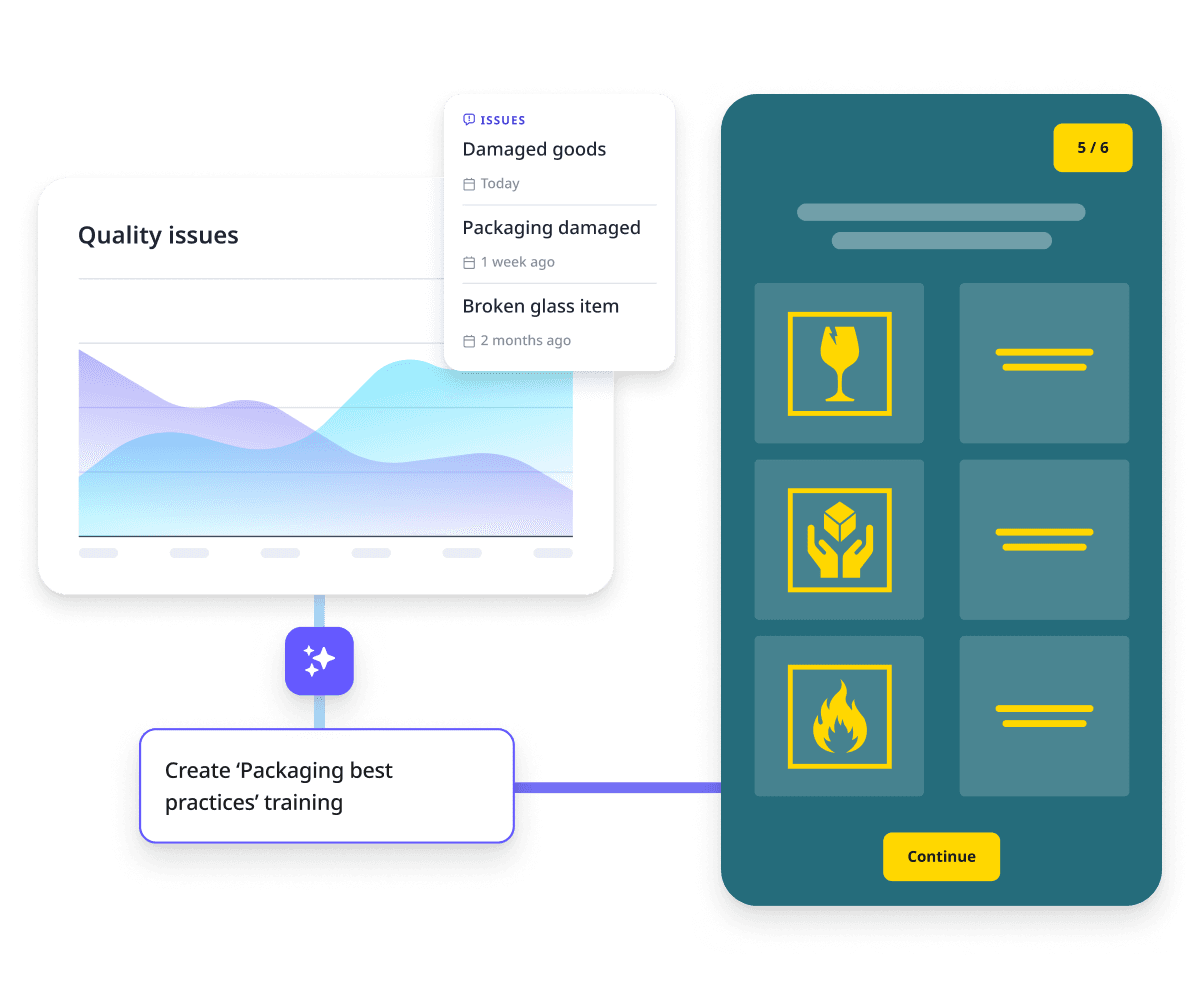
Drill down and take action

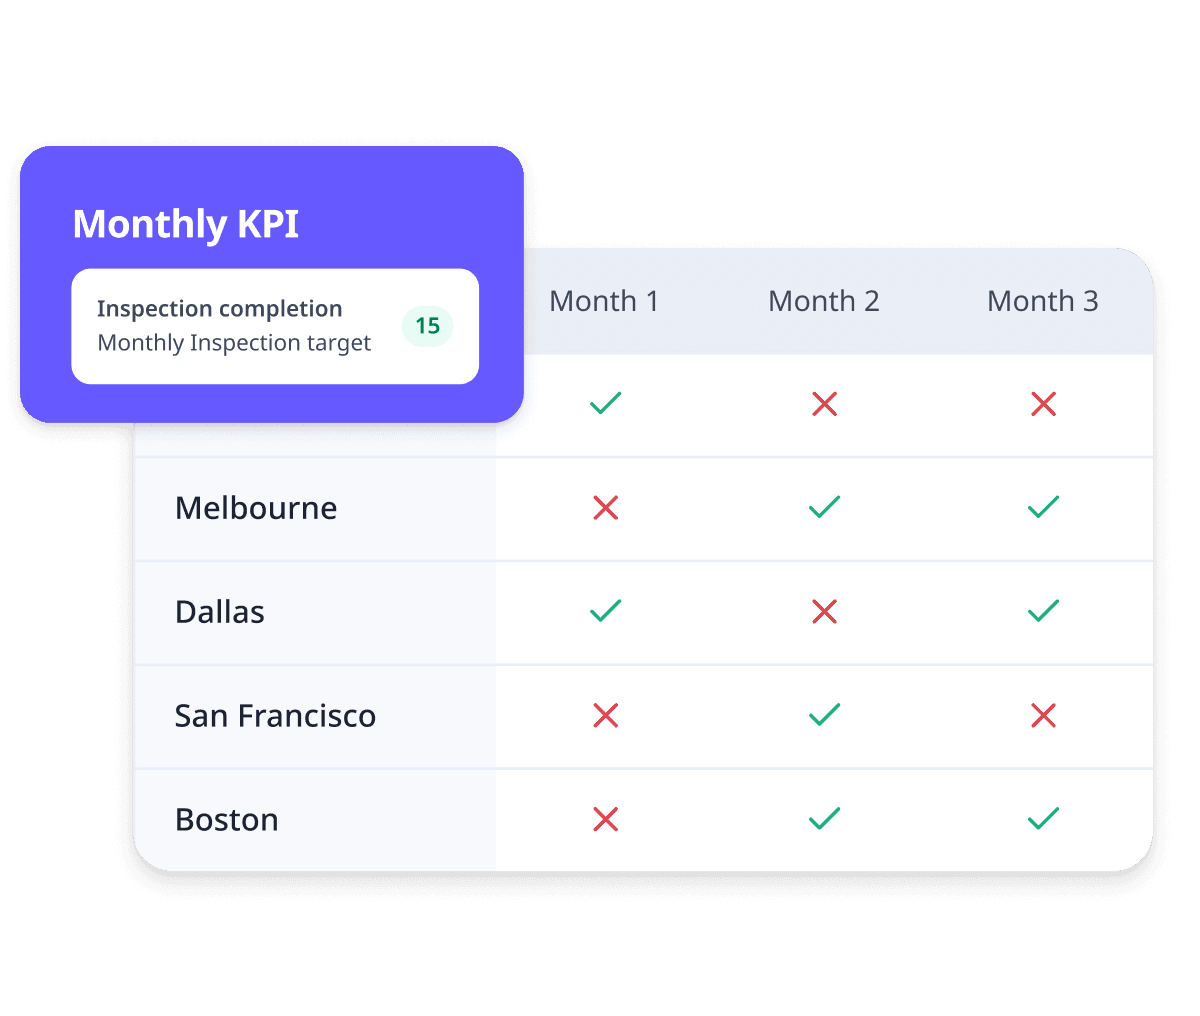
Track KPIs and compliance
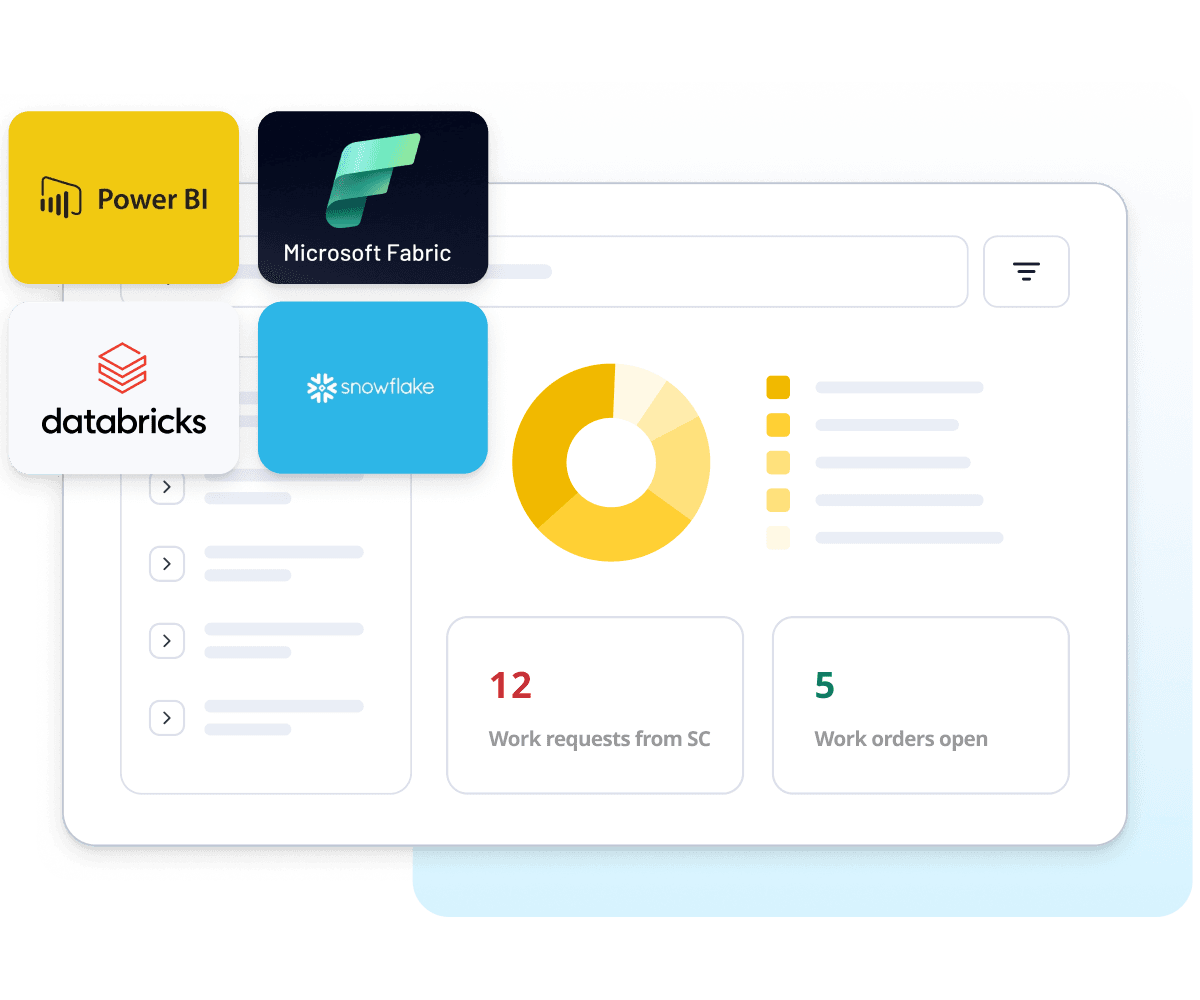
Sync with any system
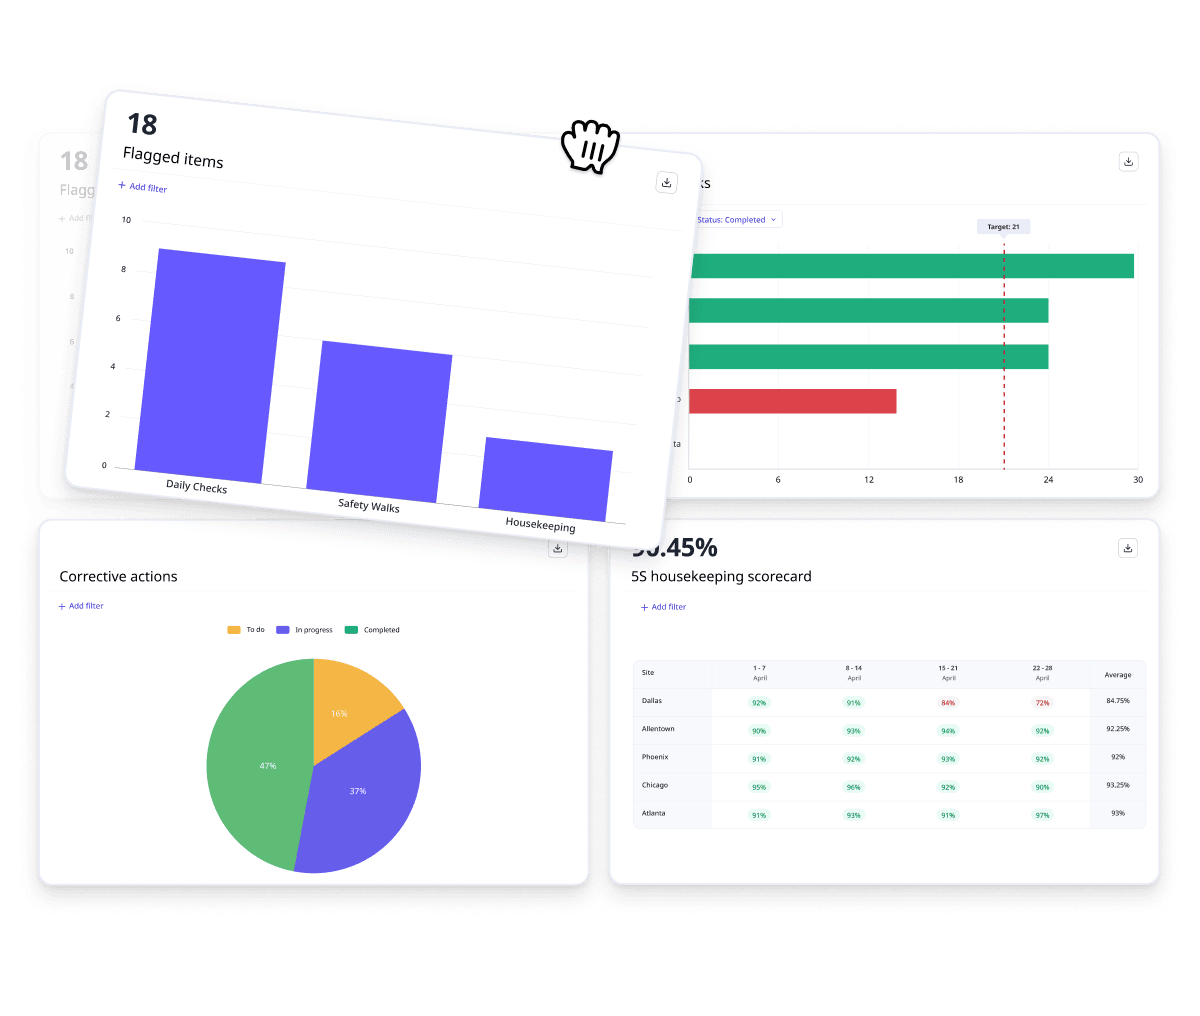
Visualize activities over time to evaluate progress, performance and completion rates.
Easily find and package supporting evidence for auditors based on specific criteria
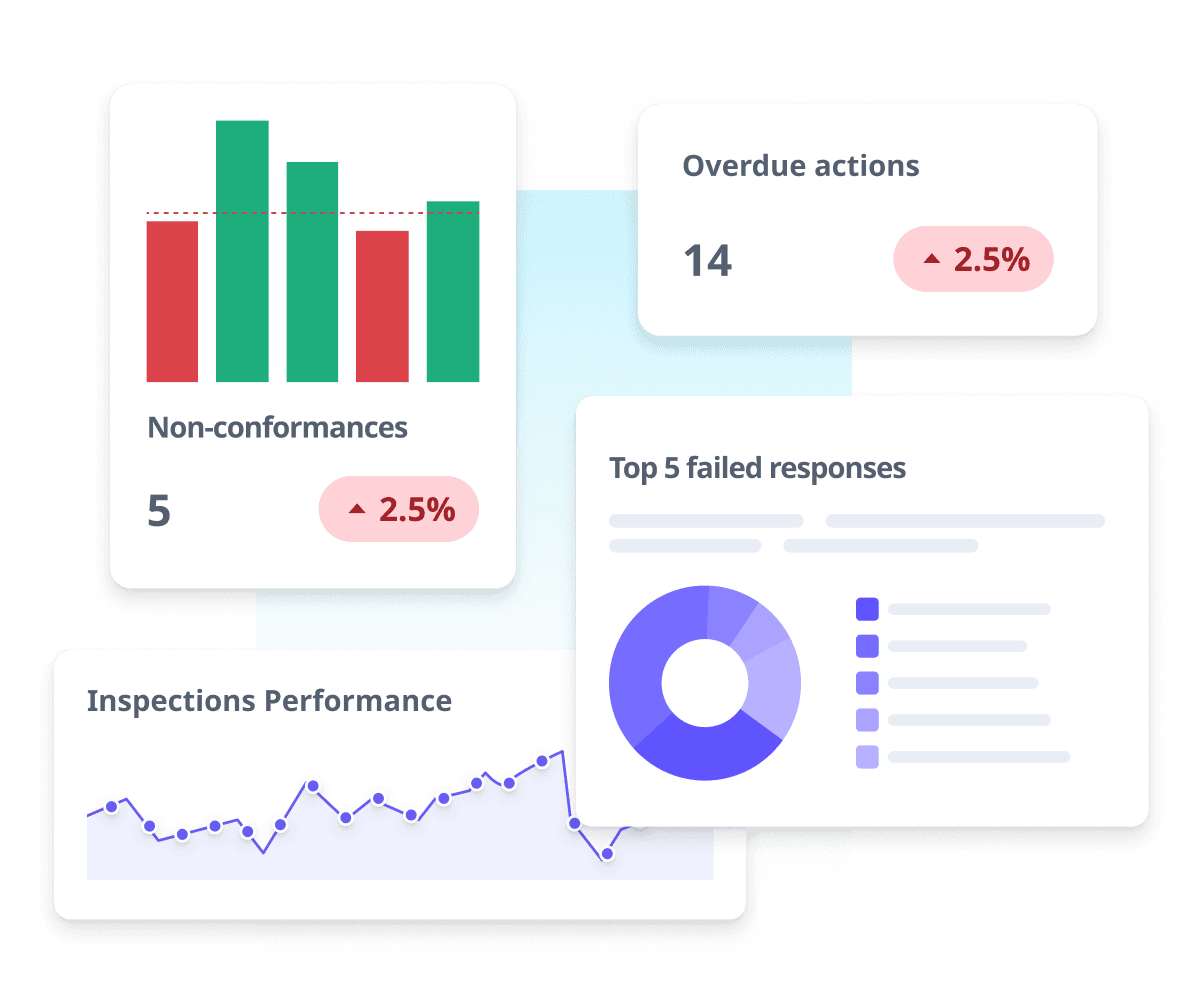
Aggregate and display key operational data in a single view, perfect for your team check ins.
Track specific metrics in real-time to measure performance against your own operational targets.
Track real-time compliance with regulatory and/or brand standards across single and multiple sites.
Identify and prioritize areas that require immediate action to address risks or issues effectively.
Ingest SafetyCulture data into your data warehouse or data lake to unlock deep analysis, a broader view of your business and power enterprise AI capabilities.


Analytics
Live operational data lets teams see, drill down, and act instantly all from intuitive dashboards that are built into their workflows.