Value Stream Mapping (VSM): Identifying Waste to Create More Value
Learn what value stream mapping is and how it can help identify waste, improve process cycles, and substantially contribute to continuous improvement.

Learn what value stream mapping is and how it can help identify waste, improve process cycles, and substantially contribute to continuous improvement.
Published 28 Apr 2026
Article by
6 min read
Value Stream Mapping (VSM), also known as “material-and-information-flow mapping” or “value stream analysis,” is a Lean manufacturing technique that aims to find and eliminate waste in existing operations using a visual overview of the process flow. This process helps analyze and manage the flow of materials and information, identify inefficiencies, and determine which steps or items do not add value from the customer’s standpoint.
The origins of VSM are often attributed to Toyota Motor Corporation that popularized Lean manufacturing. Being “Lean” focuses on eliminating the “mudas” in manufacturing to achieve its main goal of creating more value for customers.
The philosophy behind all Lean methods, including VSM, is to eliminate waste from your processes in order to maximize the profit and continuously improve the business. In order to do so, it considers details such as who is participating in the process, what processes are taking place, and how much time each process is taking.
Value stream mapping in Lean aims to critically address every step in manufacturing processes. This way, organizations can:
Identify and Minimize Waste – Waste can come in the form of time, material, and labor. A VSM serves as a handy visual guide in analyzing current processes, making it easier to pinpoint bottlenecks and develop action plans to resolve them.
Reduce Process Cycle Times – Lean VSM provides a clear view of the work process, including the kind of activities involved. It also visualizes the process cycle time or how long does one process take for items to go through them. Once the waste has been identified there will automatically be a reduction in process time. This results in a more optimized process.
Eliminate Handoffs – Handoffs means “wait-time” or when one worker needs to wait for another to complete some task. They are most commonly the place or time where things go wrong. Lack of communication can cause delays and waste. VSM identifies handoffs and helps establish what’s working and what could be improved.
Implement Continuous Improvement – Using manufacturing VSM helps identify where the sources of waste are and how much time in every cycle is used in every step of the process, giving you opportunities to save time and reduce production cost. Its goal is to make businesses see improvement areas to help them grow and scale successfully.
Raise the bar for product quality and exceed customer expectations with standardized checks across all production sites.
Value stream maps can be created with flowchart illustration or software like autoCAD. They often include symbols or icons to indicate specific parts of the process flow. These maps can be classified into two types:
Current state value stream map – This is created before making the future VSM through analysis and tracking of the information and material flow. This is used to determine what the process looks like at the present time.
Future state value stream map – This focuses on what the future value stream map will look like—including the ideal improvements to the process.
A value stream map helps you see where you can improvise and station your unused or misused resources to produce good work. It consists of the following main components:
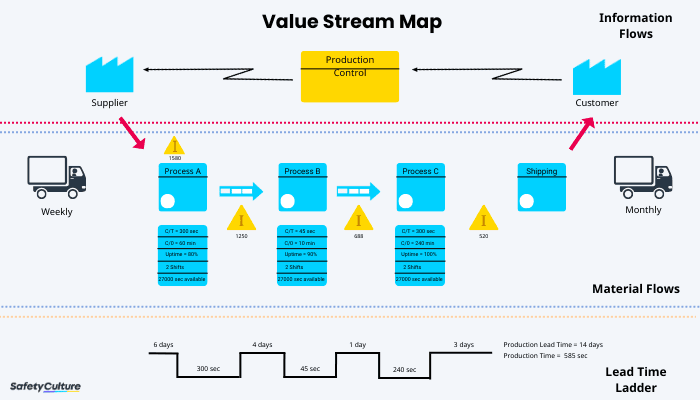
Value Stream Mapping Template | Source: Visual Paradigm
Information flows are found at the top section of a VSM. The people involved in the flow (e.g., supplier, manufacturer/manager, and consumer) are where the activities in the process will come from.
For example, the customer gives the details of what they want and when they need it. Then, the manager gives orders and directions on how to do it and where to source it. tell you what they want, where they want and when they want it.
Meanwhile, material flows are located at the middle section of the value stream map. It consists of all processes involved in making the product—from acquiring raw materials from the supplier down to the completion of the product.
The lead time ladder is placed at the bottom section of the value stream map. It shows all time taken for each and every cycle or process and the gaps between two process steps or the downtime. When the type of activity is determined, it will help eliminate downtime.
Here’s a quick guide on the types of operations or activities that occur during the process flow:
Non-value adding operations (NVA) – pertains to any action that does not add value to a product or service
Necessary but non-value adding (NNVA) operations – pertains to the activities or processes that are not creating value for the customer, but they are essential to your business.
Value-adding (VA) operations – pertains to the value given by your customers because value is always determined by the customer; this is what the customers are paying for.
To properly analyze all the flows and processes involved in the delivery of products or services to the customer, mapping is used.
Here are 7 steps from on how to analyze any manufacturing processes for value stream maps:
Document the current process – List all the current activities that are taking place.
List down all the steps in the process – Run through all the stages from the start up to the stage where the demands of the customer are met.
Identify which steps add value – Outline all the steps that add value to the customer and which don’t. Then, determine what can happen if those steps are taken out from the flow.
Visualize what the process will look like when all waste is eliminated – Define what it would look like if you could eradicate all waste and activities that do not add value.
Identify parts of the current process that hinders the way to achieve your ideal process. – Make use of your visual guides to highlight these areas.
Determine what areas can be improved and develop possible ways to improve them – This may mean an upgrade to equipment or tools. This could also mean that you need to add more people or your workers need additional training.
Assign tasks and implement the plans – This step is the stage where assignments are designated to the appropriate persons or groups to properly execute the plans.
Integrating improvement in practice
Discover how organizations like Toyota Material Handling, Mowi, Thermosash and Byblos Constructions are integrating improvement into how work is done to improve efficiency, reduce wastage and surface actionable insights across their operations.
SafetyCulture is a mobile-first operations platform adopted across industries such as manufacturing, mining, construction, retail, and hospitality. It’s designed to equip leaders and working teams with the knowledge and tools to do their best work—to the safest and highest standard.
Streamline processes, eliminate bottlenecks, enhance resource utilization, and build an agile and scalable infrastructure with SafetyCulture. Strive for operational excellence to boost competitive advantage, foster sustainable growth, and deliver long-term value.
✓ Save time and reduce costs ✓ Stay on top of risks and incidents ✓ Boost productivity and efficiency ✓ Enhance communication and collaboration ✓ Discover improvement opportunities ✓ Make data-driven business decisions