What You Need To Know About Process Diagrams
Learn how to create a process diagram — what it is, how it works, and the best types to map and improve your workflows.

Learn how to create a process diagram — what it is, how it works, and the best types to map and improve your workflows.
Published 28 Apr 2026
Article by
4 min read
A process diagram, also known as a process flowchart, is a visual representation of the steps required to complete a given task or achieve a desired outcome. They can be used by anyone from business owners to managers, team members, customers, and suppliers.
Process diagrams are commonly used in factories and other manufacturing settings, but they can also be applied in other areas such as service delivery, healthcare, research, and education.
The purpose of a process diagram is to show how a process works and the different stages it goes through. They are used to improve communication within a team, identify areas for improvement, and track progress.
The icons and symbols used in process diagrams vary depending on the type of diagram it is, but all share a common goal: to show the sequence of events and activities required to complete a task.
Process diagrams can be used for illustrating everything from the manufacturing process of a new product, to the steps involved in cooking a meal to serve. They’re versatile tools that make complex processes easier for everyone on the team to understand and follow.
However, they may not be ideal for highly abstract concepts, like customer behavior, or very technical ones, like data transformations. Though in many cases, a different type of process chart can still help businesses with their tasks.
Cultivate a culture of excellence with our digital solutions that enhance efficiency, agility, and continuous improvement across all operations.
Different processes need different types of diagrams. For example, a diagram showing how data moves through a system will most likely look different from one that maps team roles or departmental responsibilities. Each type of process uses its own flowchart, with unique symbols and shapes to represent key steps and flow.
Here are some common process diagram types:
Process Flowchart - A simple diagram that shows a step-by-step process, ideal for explaining linear workflows like incident reporting or routine procedures.
Workflow Diagram - A diagram that shows the way a business functions, often used to train newly hired employees, spot issues, and orchestrate improvements in how work gets done.
Business Process Model and Notation (BPMN) Diagram - This process diagram is best used to simplify complex business processes like process improvement or automation.
Data Flow Diagram (DFD) - This diagram shows how data moves through a system, focusing on describing what data flows where, rather than describing what happens.
Value Stream Map - This map is used in Six Sigma to show where value is created and where waste occurs within a process.
SIPOC Diagram - This diagram also supports Six Sigma to help outline the scope of processes like suppliers, inputs, outputs, and customers.
Swimlane (or Cross-functional) Process Diagram - This diagram shows how different roles or departments interact within a process, clarifying team roles and handoffs.
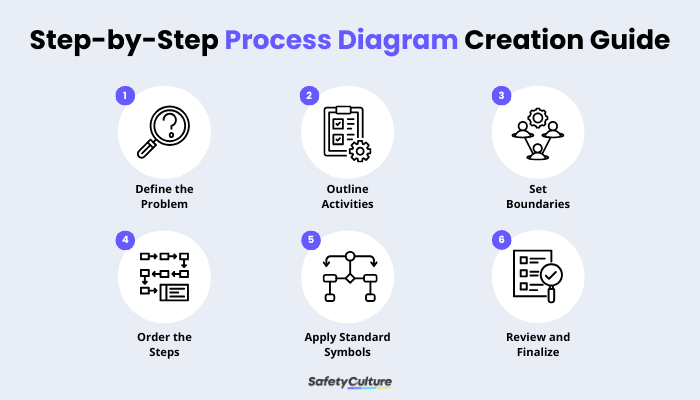
Step-by-Step Process Diagram Creation Guide
Though some may think it’s complicated to create a process diagram, it’s actually rather simple, especially when you are using templates or digital solutions such as SafetyCulture.
Below are some steps to help you create a process diagram:
Define the Problem - State the problem and the outcome you want to achieve.
Outline Activities - List key tasks to accomplish and any constraints or risks to consider.
Set Boundaries - Clarify who’s involved (roles), the scope and limitations of the task, the start trigger, and the end condition.
Order the Steps - Break the work into clear steps that make sense from start to finish.
Apply Standard Symbols - Make sure to use these symbolize to standardize communication regarding the processes to follow:
Oval - Start or End
Rectangle - Process or Task
Diamond - Decision (Yes or No branches)
Parallelogram - Input or Output (data in or reports out)
Arrows - Flow direction
Review and Finalize - Share process diagram for feedback, then refine labels and confirm accuracy.
SafetyCulture is a mobile-first operations platform adopted across industries such as manufacturing, mining, construction, retail, and hospitality. It’s designed to equip leaders and working teams with the knowledge and tools to do their best work—to the safest and highest standard.
Streamline processes, eliminate bottlenecks, enhance resource utilization, and build an agile and scalable infrastructure with SafetyCulture. Strive for operational excellence to boost competitive advantage, foster sustainable growth, and deliver long-term value.
Save time and reduce cost
Stay on top of risks and incidents
Boost productivity and efficiency
Enhance communication and collaboration
Discover improvement opportunities
Make data-driven business decisions