A Brief Guide to Fault Tree Analysis (FTA)
Learn how to strategically prevent system failure with this visual problem-solving technique

Learn how to strategically prevent system failure with this visual problem-solving technique
Published 28 Apr 2026
Article by
7 min read
Fault Tree Analysis (FTA) is a top-down, systematic method to identify root causes of an undesired event by mapping out contributing factors using logic gates like AND, OR, and INHIBIT.
FTA helps visualize complex failure pathways, enabling prioritization of remedial actions and resource allocation to improve system safety and reliability.
The analysis iteratively breaks down events to basic root causes, facilitating identification of critical failure points and common cause failures that are key risks to be managed.
Fault tree analysis is a top-down approach to problem-solving wherein the starting point of analysis is the undesired event. Events leading to the undesired event are then evaluated based on their relationship with their immediate effect, which is either another event closer to the undesired event or the problem itself.
Fault tree analysis is primarily used in safety and reliability engineering. Though FTA is essential and known in the aerospace industry, any business that aims to assess the vulnerabilities of their system to failure-causing events can use fault tree analysis.
A fault tree diagram is a key feature of FTA and is best used to explain the relationship between events. Though the FTA diagram is not the intended end result or purpose of fault tree analysis, it helps safety and reliability engineers spot and address issues that could lead to multiple undesired events.
Easily conduct a fault tree analysis with the following steps:
Define the undesired event.
Identify the requirements for the undesired event to occur.
What are the essential components of this undesired event? Without these components, the undesired event cannot occur at all.
Decide the relationship between the requirements and the undesired event and use the corresponding fault tree analysis symbols.
Guide Questions:
Do all of them need to be present for the undesired event to occur?
If yes, is their order relevant to the undesired event occurring?
If yes, use the Priority AND gate symbol.
If no, use the AND gate symbol.

If no, is a specific number of them needed for the undesired event to occur?
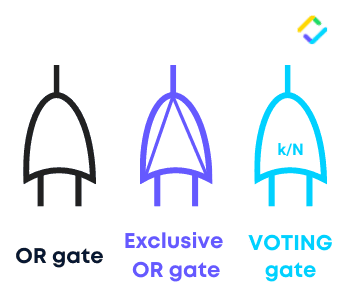
If no, use the OR gate symbol.
If yes, is the specific number more than 1?
If no, use the Exclusive OR gate symbol.
If yes, use the VOTING gate symbol.
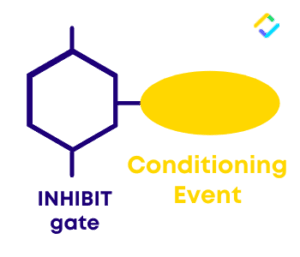
If a requirement only leads to the undesired event under a certain condition, use the INHIBIT gate symbol.
Identify the causes of each requirement.
Decide the relationship between the causes and the requirement.
Follow the same procedure as Step 3, only replace requirements with causes and undesired event with requirement.
Repeat until you reach the root causes or basic events.

Below are detailed examples of implementing fault tree analysis in different industries:
Top event: short-circuit fault [OR gate connecting top event to 1A and 1B]
Intermediate event 1A: breakdown of transmission lines
[OR gate connecting 1A to 1A-2A and 1A-2B]
Intermediate event 1A-2A: conductor resistance
Basic event 1A-2A-3A: rise in conductor temperature
Intermediate event 1A-2B: corona loss
Basic event 1A-2B-3A: ionization of air molecules near the transmission line conductors
Intermediate event 1B: transformer failure
Intermediate event 1B-2A: insulation failure
[INHIBIT gate connecting 1B-2A to 1B-2A-3A and conditioning event]
Conditioning event: fault current passes through transformer
Intermediate event 1B-2A-3A: sufficient insulation deterioration
[OR gate connecting 1B-2A-3A to 1B-2A-3A-4A and 1B-2A-3A-4B]
Intermediate event 1B-2A-3A-4A: thermal aging
Intermediate event 1B-2A-3A-4A-5A: excessive temperature
Basic event 1B-2A-3A-4A-5A-6A: transformer overloads
Intermediate event 1B-2A-3A-4B: mechanical stress
Basic event 1B-2A-3A-4B-5A: transient power frequency currents
The above fault tree analysis example in a visual format:

Disclaimer: Since the focus of this example is to show a fault tree analysis, other technical elements relating to a short-circuit fault may be incorrect.
To also provide a clearer understanding of how to implement this problem-solving method in another industry, below is a fault tree analysis example in the construction sector, specifically in the process of pouring concrete:
Main Event: Poor Quality Concrete Pouring
This is the main event or the top-level failure that we want to analyze and understand its potential causes.
Primary Causes:
Insufficient Concrete Mix Design
Incorrect proportions of concrete ingredients (cement, aggregates, water, admixtures)
Inaccurate batching or mixing of the concrete
Contamination of aggregates or cement
Improper Concrete Placement and Consolidation
Inadequate compaction of the concrete
Insufficient vibration during concrete placement
Uneven concrete pouring or leveling
Environmental Factors
Extreme weather conditions (high or low temperatures, rainfall, wind)
Improper curing due to environmental factors
Secondary Causes:
Insufficient Concrete Mix Design
Inadequate testing or analysis of concrete mix design
Lack of expertise or knowledge in designing appropriate concrete mixes
Improper Concrete Placement and Consolidation
Inadequate training or experience of workers in concrete placement and consolidation techniques
Lack of proper equipment for concrete placement and consolidation (vibrators, screeds, etc.)
Environmental Factors
Inadequate weather monitoring or forecasting
Failure to take necessary precautions based on weather conditions
Tertiary Causes:
Insufficient Concrete Mix Design
Lack of quality control and quality assurance measures
Poor communication between design engineers and concrete suppliers
Improper Concrete Placement and Consolidation
Inadequate supervision and inspection during concrete pouring
Lack of adherence to industry standards and best practices
Environmental Factors
Inaccurate assessment of the project site’s environmental conditions
Failure to implement appropriate measures to mitigate the effects of adverse weather conditions
The most critical part of fault tree analysis is the evaluation of the fault tree diagram. Using the diagram as a visual representation of failure paths, safety and reliability engineers can better identify which elements need to be removed or modified to prevent failure.
Beyond simple identification of failure hazards, the gate and event symbols also help safety and reliability engineers strategically plan for how best to attack failure. They are able to know when and where they should add failure control measures and prioritize and allocate resources accordingly.
Another benefit of fault tree analysis is the ability to get Common Cause Failures (CCFs) when comparing the events of multiple fault trees within a single system. CCFs can be described as the highest priority risks to a system’s safety and reliability.
Since these elements are the most likely to cause failure within a system, CCFs should be closely monitored to help prevent them from going further up failure paths and causing overall system failure.
✓ Scale ✓ Data ✓ Security ✓ Integration ✓ Teams
How do you fix a system if you don’t know the exact problems that need fixing? While most teams already have an idea of the problems they need to solve, some teams may still have difficulty in identifying the problems that are harming their system.
For those who want to ensure that they start their fault trees with the right problems and not waste their time making fault tree diagrams for random issues, consider using SafetyCulture (formerly iAuditor).
Using SafetyCulture, you can see which undesired events have the largest negative impact on your system and spot trends in system failures. You can do the following and more with SafetyCulture:
Help those on-the-ground gather information with photos and annotations
Incorporate inspections into your failure information database
View timelines of failure resolutions using the Actions feature
Book a demo to see how SafetyCulture works, get started for free, or take a look at some of our featured templates for root cause analysis below.
This general root cause analysis template can help you do the following:
Assess the impact of the problem
List potential reasons for the problem to occur
Rate the probability for each reason to be the root cause
Categorize the problem’s root cause
Implement a solution for prevention
You can use this 5 Whys template to support fault tree analysis by doing the following:
Clearly define the problem
Ask 5 whys to identify the root cause
Provide a solution to the root cause
Create corrective actions
To try out the reverse of fault tree analysis, perform FMEA using this template:
Specify the function (process step or input)
State the potential failure mode, effect, and cause
Assign the severity, occurrence, and detection ratings
Evaluate the effectiveness of current controls
Safety committees can use this JSA template to do the following:
Describe the job step / task
Identify the potential hazards
Take a photo of the step / task
Explain hazard control measures
Add your recommendations
System engineers can use this HAZOP template to identify the system’s functional flaws by doing the following:
Analyze the system’s design and purpose
Add HAZOP nodes and guide words
Specify the system element and its deviation
State the possible causes and consequences
Determine the appropriate safeguards