BCG Growth Share Matrix: How Does it Work
Learn about the Boston Consulting Group (BCG) Matrix, a tool used by businesses to analyze their product portfolios and discover the advantages and disadvantages it presents.

Learn about the Boston Consulting Group (BCG) Matrix, a tool used by businesses to analyze their product portfolios and discover the advantages and disadvantages it presents.
Published 28 Apr 2026
Article by
8 min read
The BCG Matrix is a strategic framework that classifies products into Stars, Cash Cows, Question Marks, and Dogs based on market share and growth.
Stars demand investment to sustain growth, Cash Cows provide stable revenue, Question Marks require evaluation, and Dogs often signal the need for divestment.
Building a BCG Matrix involves analyzing market growth and share, then plotting products accordingly.
The BCG Matrix, also known as the BCG Growth Share Matrix, is a strategic management tool that helps companies analyze their product portfolios. The matrix categorizes a company’s products or services into four categories: Stars, Cash Cows, Question Marks, and Dogs. Each category represents a different level of market share and growth potential. A growth-share matrix can help them allocate resources, prioritize investment, and decide which products to invest in and which to divest.
There are several advantages to using the BCG (Boston Consulting Group) or Boston Matrix, including the following:
The concept is clear and easy to understand.
This tool assists in efficiently evaluating available opportunities and devising strategies to optimize their potential.
It helps companies determine how to deploy cash resources best to maximize future growth and profitability.
This matrix provides a framework for allocating resources across different products and allows a glance comparison of the product portfolio.
Despite its many advantages, the BCG Matrix, or growth share matrix, is not without its constraints. Some of its limitations include the following:
The BCG Matrix employs two dimensions—relative market share and market growth rate—which doesn’t exclusively indicate profitability, attractiveness, or success
The synergy between brands is ignored.
Even businesses with a low market share have the potential to generate profits.
Obtaining a high market share can come with high costs and doesn’t always result in increased profits.
Dogs can occasionally provide a competitive edge for businesses or products.
The model doesn’t account for small competitors with rapidly increasing market shares.
The BCG Matrix analyzes a company’s existing product portfolio based on market growth rate and market share. The matrix divides products into four categories: stars, cash cows, question marks, and dogs. It helps businesses decide about resource allocation and investment based on the potential for growth and profitability.
On the other hand, the Ansoff Growth Matrix focuses on analyzing a company’s growth opportunities based on two factors: products and markets. The matrix divides growth strategies into four categories: market penetration, market development, product development, and diversification.
The Ansoff Growth Matrix allows businesses to identify potential growth opportunities and make strategic product and market expansion decisions.
Boston Matrix consists of four quadrants, where products can fall, each with its characteristics and strategic implications. Below is a brief explanation of each:
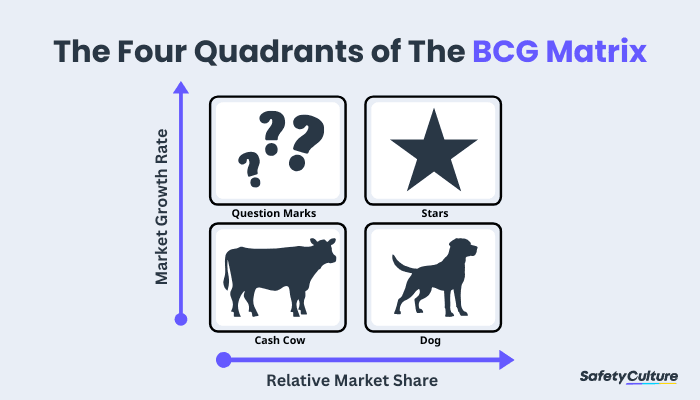
The product group known as the “Question Marks” has a low market share but is experiencing high growth. Although not currently very profitable, these products have the potential for market share growth and can become cash cows and, ultimately, stars with appropriate investments.
The product group under “Stars” has a significant market share and is experiencing rapid growth. Investing in this group is beneficial in maintaining their market share and further development.
“Cash Cows” have a high market share but minimal growth potential. The reason is that they’re operating in a mature market that lacks innovation and growth. However, they’re profitable and require minimal investment to maintain their position.
Revenue from these products can be used to invest in Stars or Question Marks.
“Dogs” have a small market share and operate in a slow-growing market. They don’t generate cash and don’t require large amounts of it either. They aren’t a good investment because they have low or negative cash returns and may need significant financial support. Their low market share also puts them at a cost disadvantage.
Question Marks | Stars |
The future of these products is uncertain, and they’re considered unpredictable, with the possibility of success or failure. High market growth Low market share Cash absorbing Build | The products or brands here have great potential to generate high returns on investment. High growth market High market share Cash neutral Hold |
Cash Cows | Dogs |
The products here produce steady cash flow and stability but have limited potential for expansion. Low market growth High market share Cash generating Milk | These low-value products are often challenging to profit from and can drain resources. Low market growth Low market share Cash neutral Diversify |
One way to use the BCG matrix is to analyze the product lifecycle of each product in your portfolio. The product life cycle comprises four stages: introduction, growth, maturity, and decline. By understanding where each product is in its lifecycle, you can determine its appropriate position on the BCG matrix.
Coca-Cola is a globally recognized consumer product company with multiple product lines that can be classified into various categories using the BCG Matrix. An example of a BCG growth share matrix, categorized for some of their products, is provided below.
Stars – Dasani, Coca-Cola’s bottled water brand, is currently in the product life cycle in the international market. The company can invest in marketing and advertising to boost market share and growth.
Cash Cows – The brand “Coca-Cola” has established a strong presence in the carbonated soft drink market and is a significant revenue source.
Question Marks –There is a potential opportunity in the Fanta and other beverages market, as consumers are becoming more health-conscious. Coca-Cola could either discontinue these products, improve quality, or invest in advertising to increase customer appeal.
Dogs – Considering its low market share and lack of profitability, Coca-Cola may discontinue its Diet Coke product line, especially since its similar product, Coca-Cola Zero, is more prevalent among consumers.
Creating a BCG matrix may seem complicated because of its visuals, but it’s fairly straightforward. Here are the steps to make a growth-share matrix:
The BCG matrix is a helpful tool for analyzing business units, whether individual brands, products, or a firm as a whole. Choosing the particular unit to assess is crucial since the decision impacts the whole process.
Accurately defining the market is essential for understanding portfolio position. An incorrect market definition can lead to a misclassification of the product.
Based on revenue or unit volume, market share measures how much of a company’s total market it serves. In the BCG matrix, relative market share is used to compare a product’s sales to those of its main competitor for the same product.
Here’s how to compute the relative market share:
Relative Market Share = Product’s sales this year/Leading competitor’s sales this year
Relative market share can be calculated by comparing your firm’s brand market share to your competitors in a given industry. For example, if your competitor has a market share of 25% and you have a market share of 10%, your relative market share would be 0.4.
You can determine the growth rate of an industry by using online resources or by analyzing the average revenue growth of leading companies. The market growth rate is typically presented as a percentage.
The calculation is as follows:
(Product’s sales this year – Product’s sales last year) / Product’s sales last year
High-growing markets have a large pool of potential customers, creating numerous opportunities for companies to generate revenue.
Once you have determined each product or business unit’s market share and growth rate, the next step is to draw the circles on a matrix. The BCG matrix is a simple two-by-two grid with a market share on the x-axis and a growth rate on the y-axis.
To draw the circles, you will need to determine the size of each circle based on the market share of the product or business unit. The larger the market share, the larger the circle. You can use software tools or manually create the circles.
Empower your team with SafetyCulture to perform checks, train staff, report issues, and automate tasks with our digital platform.
SafetyCulture is a mobile-first operations platform adopted across industries such as manufacturing, mining, construction, retail, and hospitality. It’s designed to equip leaders and teams with the tools to do their best work– to the safest and highest standard.
Our solution is designed to help drive improvements in your enterprise operations.
✓ Save time and reduce costs ✓ Stay on top of risks and incidents ✓ Boost productivity and efficiency ✓ Enhance communication and collaboration ✓ Discover improvement opportunities ✓ Make data-driven business decisions
In this article