Critical to Quality (CTQ): Guide to Customer-Driven Excellence
Discover how Critical to Quality factors translate customer needs into measurable standards that improve product quality, service reliability, and process efficiency.

Discover how Critical to Quality factors translate customer needs into measurable standards that improve product quality, service reliability, and process efficiency.
Published 28 Apr 2026
Article by
6 min read
Critical to Quality (CTQ) is a specific list of features or performance standards that a product must have to meet customers' expectations. By turning the Voice of the Customer (VoC) into measurable metrics, tolerances, and KPIs, companies can ensure consistent product or performance delivery, with minimal variation, defects, and process inefficiencies.
Critical to Quality is the essential link between what a customer wants and how a business delivers. By ensuring every improvement creates genuine value, CTQ transforms a standard Quality Management System into a powerful driver of growth and consistency, providing the following long-term benefits:
Boosts operational efficiency: CTQ is designed to simplify daily tasks by removing unnecessary steps. As a starting point for Lean Six Sigma, this method drives substantial gains in operational efficiency.
Guides better decision-making: Instead of guesswork, this strategy provides clear data on what requires fixing. It aids in better resource and time allocation.
Reduces defects and improves quality: This approach helps teams avoid mistakes. By creating smoother and more reliable processes, this method ensures every deliverable precisely matches the customer's needs.
Strengthens competitive advantage: Consistently meeting quality targets is the most effective way to drive up ACSI scores. This provides a significant market advantage and strengthens job security for the entire team.
Enhances customer satisfaction and loyalty: CTQs help the company focus its efforts on what customers really care about. When they are truly satisfied, they come back for more and endorse the product or service to others.
Raise the bar for product quality and exceed customer expectations with standardized checks across all production sites.
Pioneered at Motorola to achieve "Zero Defects," the Six Sigma approach bridges the gap between customer expectations and actual production. It is best visualized through a Critical to Quality tree, which breaks down broad quality standards and needs into specific, actionable service or product specifications:
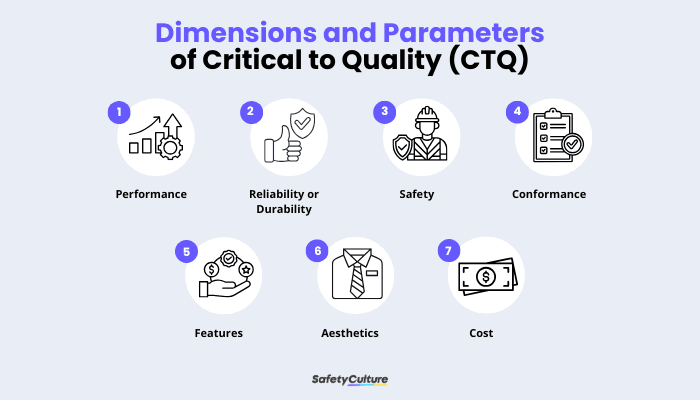
This measures how well a product performs its main task, like speed or accuracy. Functional tests and performance benchmarks help set targets for these parameters.
Throughput
Cycle time
Response time
Defect rate
Productivity levels
Long-term consistency and failure prevention are crucial. Data from stress tests, failure mode analysis, and historical failure data reviews determine the following:
Mean Time Between Failures (MTBF)
Warranty claims
Downtime frequency
Return rates
Maintenance costs
This protects users and staff by identifying and minimizing risks. Risk assessments and safety audits establish these metrics:
Lost Time Injury Frequency Rate (LTIFR)
Total Recordable Incident Rate (TRIR)
Near-miss reports
Safety audit scores
Regulatory violations
This tracks how closely work meets specific standards or rules. Regular audits, inspections, and sampling verify that every output stays within the required technical and legal specifications:
First-pass yield
Defects Per Million Opportunities (DPMO)
Rework percentage
Additional characteristics or functionalities enhance value beyond basic performance. Usability testing and customer feedback help define these additional traits, determining these parameters:
Feature adoption rate
Customer usage metrics
Enhancement requests
Appearance, design, look, feel, and sensory appeal greatly influence customer perception and preference. Design reviews, visual inspections, and customer surveys are the go-to tools to track these key metrics:
Customer Satisfaction (CSAT)
Net Promoter Score (NPS)
Brand perception ratings
Balancing quality with budget control without sacrificing customer expectations is the goal for many manufacturing and service-oriented companies. Process reviews and value stream mapping identify these targets:
Cost of Poor Quality (COPQ)
Unit costs
Rework costs
Scrap rates
Budget variance
Build from scratch or choose from our collection of free, ready-to-download, and customizable templates.
The Voice of the Customer is only valuable when it drives action. Converting this into Critical to Quality data provides a structured way to transform opinions into precise quality requirements. Here’s a basic guide that aligns with the DMADV methodology:
In the Define phase, VOC is gathered through surveys, interviews, complaints, market research, and observations. All these are clearly documented and matched with project goals and scope.
The Measure phase involves translating customer needs into CTQ trees. Broad customer feedback is broken down into key quality drivers, which are then turned into specific, measurable targets we can track and manage
In the Analyze phase, CTQs are converted into measurable specifications, targets, and tolerance limits. This ensures each CTQ is feasible, data-driven, and aligned with customer expectations and process capabilities.
The Design phase uses validated CTQ to develop the product, service, or process. Testing and pilot designs are reviewed with stakeholders to verify that all critical quality targets are accurately met.
In the Verify phase, CTQs are tested in real or simulated conditions. Performance data and customer feedback prove that the important quality targets are being met. It ensures the final result truly matches what customers asked for.
Translating VoCs into CTQs is only the starting point. To sustain quality, organizations must continuously measure and monitor performance to ensure requirements are consistently met and deviations are caught early.
Performance benchmarks define the current state of CTQs before improvements or controls are implemented. This is the reference point that helps teams quantify progress, identify gaps, and set realistic performance targets.
Monitoring tools, such as visual charts, track parameters over time, distinguishing normal process variation from special causes. Working as an early warning system, these detect early signs of instability, preventingdefects and stopping mistakes before they happen.
Digital logging reduces manual errors and ensures real-time visibility into CTQ performance. By using sensors, software platforms, and integrated systems, teams can continuously monitor trends and respond faster to deviations.
Regular walkthroughs confirm that current methods are working as intended. These check-ins ensure data accuracy, tools reliability, and consistent adherence to the safest and best practices.
Reviewing long-term patterns uncovers the “big picture” habits that single data points from the day’s work do not show. Trend analysis, regression, and capability studies are some tools that help predict future performance and support proactive quality improvements.
SafetyCulture is a mobile-first operations platform adopted across industries such as manufacturing, mining, construction, retail, and hospitality. It’s designed to equip leaders and working teams with the knowledge and tools to do their best work—to the safest and highest standard.
Standardize CTQ parameters across all inspections, removing personal bias and ensuring that critical performance trends or metrics are never overlooked. Monitor quality across multiple sites simultaneously, flagging “fails” as soon as they happen, and instantly converting these into corrective actions assigned to a team member. Ensure production goals and quality goals are perfectly aligned, responding faster to defects and driving consistent improvements across the entire organization through a unified platform.
✓ Save time and reduce costs
✓ Stay on top of risks and incidents
✓ Boost productivity and efficiency
✓ Enhance communication and collaboration
✓ Discover improvement opportunities
✓ Make data-driven business decisions
In this article