How To Use A Turtle Diagram For Effective Business Processes
In this article, learn why turtle diagrams are important and how they can be used to improve your system.

In this article, learn why turtle diagrams are important and how they can be used to improve your system.
Published 28 Apr 2026
Article by
5 min read
A turtle diagram, also called a process turtle, is a visual representation used to show a process’s requirements, inputs, and outputs. The name comes from the way the base diagram resembles a turtle shell, with each section representing a different part of the system.
Turtle charts are commonly used in business process improvement projects to map out the current state of a process and identify opportunities for improvement. They can also be used to map out the future state of a process after rolling out enhancements. They’re a simple, effective, and free tool for any organization looking to improve how its processes work.
A turtle diagram is a powerful tool for simplifying your understanding of a complex system. Often used in process mapping for quality management systems like ISO 9001, this helps visualize workflows, roles and responsibilities, inputs, and outputs in a distinctive turtle-like shape.
This diagram is used to identify potential areas of improvement in a system and track the progress of changes made. While turtle diagrams can be helpful in a variety of situations, they’re particularly useful for businesses that rely on complex processes. By using a turtle diagram, businesses can better understand their processes and see what’s working and what needs fixing.
Unlock hidden efficiency
Middle managers lose over 5 hours each week on low-value tasks—time that could be spent driving meaningful progress. Learn why they hold the key to operational success.

While there are many ways to map processes and identify bottlenecks, such as the Ishikawa diagram, the turtle diagram is often the easiest to understand, especially for quality management systems.
There are many benefits to using turtle diagrams. They can be used to:
Quickly identify relationships between different elements of a system
Communicate complex information to stakeholders in a clear and concise manner
Help see the system as a whole, rather than as a series of individual parts
Generate hypotheses about how a system works
Make informed decisions about strategic partnerships, business processes, and product development
Cultivate a culture of excellence with our digital solutions that enhance efficiency, agility, and continuous improvement across all operations.
When creating a turtle diagram, you need to identify six key areas to map your processes. These areas would be acting as the arms and limbs that sit around the central process or the “turtle body”.
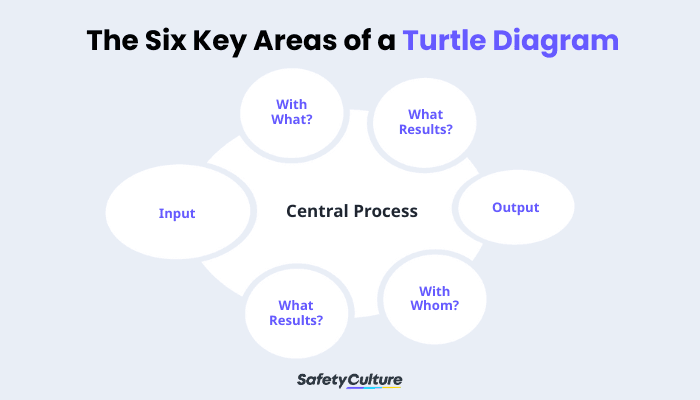
The Six Key Areas of a Turtle Diagram
The six key areas surrounding the central process are:
Inputs: materials & equipment (what)
Procedures and methods (how)
Support processes (with what)
Competence skills and training (who)
Outputs
Performance indicators (results)
To make it easy, you can use a method similar to the Supplier-Input-Process-Output-Customer (SIPOC) framework for reference. Let’s explain each area to better understand how to use it in this section.
The process is located in the center of the diagram. It is the primary activity that transforms the inputs into outputs. This box addresses the important steps and sequences inside the scope of the project. This usually includes employees and multiple departments inside your organization.
This is the area where you put details of the actual process input. You must identify and list all requirements the process needs in order to complete its transformation. This could be workers, tools, space, information, etc.
Procedures and methods are listed under support processes because they are generally what is used to help the primary process take place. This addresses the question of how the organization does things.
These refer to the processes or activities that are required to support the primary process. Support processes are not value-adding but are nonetheless necessary for the success of the primary process. These are listed to the left of the process box and generally address the question of what the organization needs.
This addresses the people or crew that will be completing the project. They need to be competent, qualified, and prepped with the proper skills and training to prevent errors and meet quality standards. This area sits at the upper right of the central process and answers if your team needs more training or more people.
This area details the specific indicators that will be used to measure the performance of the process. These indicators track how well the central process meets your goals, which is essential for process improvement. This area acts as the back left leg in a turtle diagram.
Outputs are the results of the main process. They answer what the organization produces or what outcome the project delivers. This can include products, services, or rejected components that still need to meet quality standards. The outputs sit to the right of the central process, forming the tail of the turtle.
A practical example of a turtle diagram can be found in manufacturing, such as in the assembly of a steel beam for construction use. An industrial plant that manufactures steel beams would need to follow ISO 9001:2015 Clause 8.5 for controlled production.
In this case, the six areas would be as follows:
Inputs (head): Cut steel sections, bolts, welding consumables, and shop drawings from fabrication upstream.
Outputs (tail): Assembled beams with fit-up verification, tagged for NDT and painting before erection.
Methods/How (front legs): Bolting sequences, tack welding protocols, and alignment checks per AISC standards.
Resources/What (back legs): Jigs, cranes, torque wrenches, and measuring tapes calibrated monthly.
People/Who (front right): Fitters and riggers with ICC structural steel certification and annual safety training.
Metrics (back right): Fit-up tolerance <1/8 inch, assembly cycle time <4 hours/unit, rework rate <2%
SafetyCulture is a mobile-first operations platform adopted across industries such as manufacturing, mining, construction, retail, and hospitality. It’s designed to equip leaders and working teams with the knowledge and tools to do their best work—to the safest and highest standard.
Streamline processes, eliminate bottlenecks, enhance resource utilization, and build an agile and scalable infrastructure with SafetyCulture. Strive for operational excellence to boost competitive advantage, foster sustainable growth, and deliver long-term value.
✓ Save time and reduce costs
✓ Stay on top of risks and incidents
✓ Boost productivity and efficiency
✓ Enhance communication and collaboration
✓ Discover improvement opportunities
✓ Make data-driven business decisions